


Annual consumption overview
Key insights
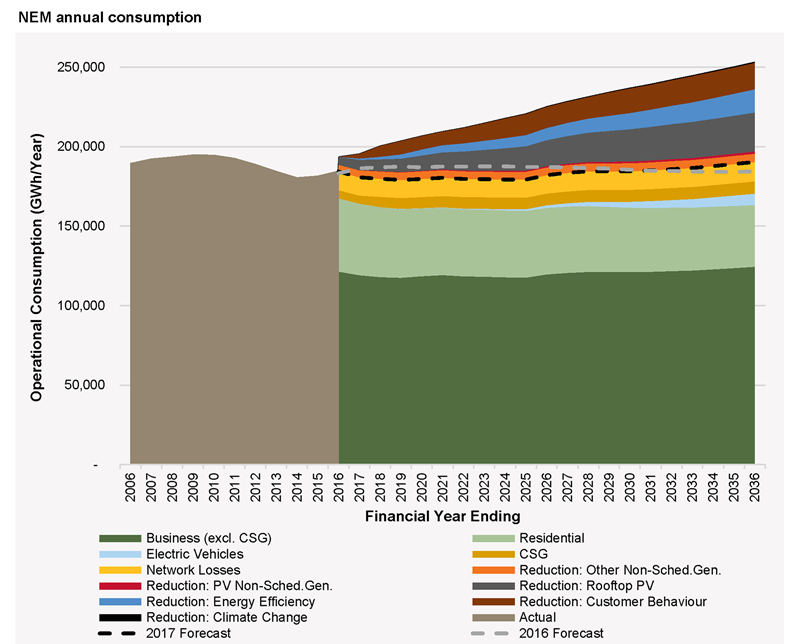
- Over the 20-year forecast horizon, annual operational electricity consumption in the NEM is forecast to remain relatively flat, growing less than 6% over the forecast period (180,750 gigawatt hours (GWh) in 2016–17 to 191,049 GWh in 2036–37 in the Neutral scenario).
- Forecast consumption is initially flat, as rapid uptake of rooftop PV and energy efficiency measures offset growth from forecast increases in population and economic activity.
- From the mid-2020s, consumption growth is projected to resume, as growth drivers are complemented by consumption from the projected increase in electric vehicles (EVs), and growth in rooftop PV slows down.
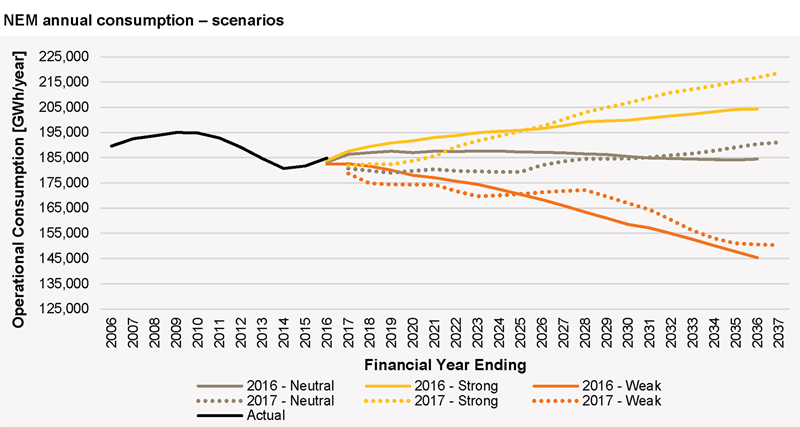
- Overall, forecast annual consumption for the NEM ends up at approximately the same level as in the 2016 National Electricity Forecasting Report (NEFR).
- The Strong scenario projects consumption growing faster, ending approximately 14% higher by 2036–37 than in the Neutral scenario, driven by assumed stronger growth in population and the economy overall. These drivers are projected to work in the opposite direction in the Weak scenario. In this scenario, consumption is forecast to continue decreasing, ending up 21% below the Neutral scenario by 2036–37.
Forecasts for the Strong and Weak scenarios, for the NEM overall and by individual NEM regions, are available from the forecasting data portal.
Regional insights
Regional forecasts generally share the national trends, with differences highlighted below.New South Wales
Strong projected growth in rooftop PV uptake means New South Wales is forecast to become the NEM region with the largest installed capacity by the end of the forecast horizon. Combined with consumer behavioural responses, New South Wales' projected consumption trends are slightly lower than the NEM overall forecasts, expected to grow 4.6% overall over the 20-year forecast period, from 66,039 GWh in 2016–17 to 69,056 GWh in 2036–37.
Queensland
Coal Seam Gas (CSG) production growth, a continuing strong driver behind Queensland consumption growth, is projected to stabilise from 2018 onwards. Projected growth in CSG sector consumption in 2017–18 is expected to counter the recent reduction in demand from aluminium smelting consumption in Queensland. Overall, consumption is projected to grow 9.0% in the 20-year forecast period, from 50,484 GWh in 2016–17 to 55,004 GWh in 2036–37.
South Australia
Projections for strong growth in rooftop PV and other consumer changes, along with closure of the automotive industry, are forecast to result in lower consumption in the next two years. Over the 20-year forecast period, consumption is projected to grow 4.2%, from 12,543 GWh in 2016–17 to 13,069 GWh in 2036–37.
Tasmania
With limited forecast growth in rooftop PV, consumption is forecast to increase, initially driven by projected increased business consumption, despite relatively weak population and economic growth projections. Overall, consumption is projected to grow from 10,442 GWh in 2016–17 to 10,943 GWh by 2036–37, an expected increase of 4.8% over the period.
Victoria
Following an initial forecast decline in consumption, the forecast is for a flat outlook. From the mid-2020s, consumption is projected to increase, as in the rest of the NEM, resulting in an overall projected increase of 4.2% over the 20-year outlook period, from 41,243 GWh in 2016–17 to 42,977 GWh in 2036–37.