


Maximum and minimum demand
Key insights 
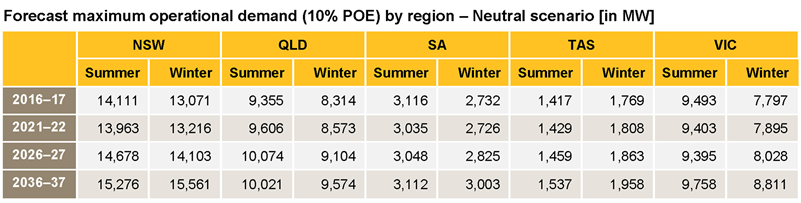
- Maximum operational demand (10% POE) currently occurs, and is expected to continue occurring, in summer, driven by cooling load (in all regions but Tasmania, where the peak is in winter, driven by heating load).
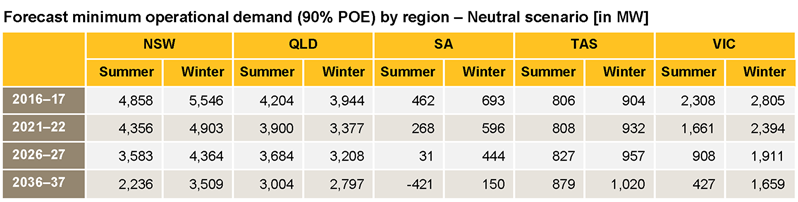
- Minimum operational demand (90% POE) occurs in the shoulder months (in all regions but Tasmania, where it occurs in summer). This is expected to continue over the outlook period.
- Both minimum and maximum operational demand are shifting to later in the day, driven by increasing contribution from rooftop PV. Minimum operational demand is expected to occur in the middle of the day by the mid-2020s. Maximum operational demand is expected to shift later in the day by an hour or two, when PV contribution is falling but temperatures are remain high (depending on the region and POE).
- Updated forecasts of maximum operational demand (10% POE) are initially slightly lower than forecast in 2016. In New South Wales and Victoria, growth in maximum demand is expected to follow a steeper trajectory than forecast in 2016. In Tasmania and Queensland, forecasts are expected follow the same trajectory as in 2016, while in South Australia maximum demand is expected to be higher than last year’s declining trend.
- Relative to the Neutral scenario, the maximum demand forecast in the Weak scenario has a flatter trajectory, and in the Strong scenario has a greater increase.
Note that in these tables, operational demand means operational demand on a sent out basis.
Regional insights
For detailed regional forecast data for maximum and minimum operational demand, see the forecasting data portal.
New South Wales
- Maximum operational demand is expected to remain relatively flat until 2023–24, then increase through to the end of the forecast period.
- Increases are attributed to appliance uptake, increasing cooling load, and population growth. In the short term, increases in maximum operational demand are forecast to be offset by increases in the installed capacity of rooftop PV. In the mid to late 2020s, maximum demand is forecast to shift to later in the day, just before or during sunset while temperatures are still high and generation from installed rooftop PV falls with lower solar radiation.
- Maximum operational demand (10% POE) is forecast to continue occurring in summer until late in the forecast period, when New South Wales is forecast to become predominantly winter peaking, as rooftop PV has a bigger offsetting impact during summer. The 90% POE maximum demand is generally winter peaking, driven by heating load, throughout the forecast period.
- Minimum operational demand is expected to decline, driven primarily by projected increasing contribution from rooftop PV. This projected increase in rooftop PV is also expected to drive minimum demand to the middle of the day by the mid-2020s.
Queensland
- The region’s maximum operational demand (excluding coal seam gas (CSG)) is expected to remain flat through to the mid-2020s, then increase through to the end of the forecast period.
- Electricity consumption for CSG production is forecast to add 1 gigawatt (GW) to the maximum operational demand (10% POE) by the end of the 20-year forecast period.
- In the Weak scenario, Queensland’s maximum operational demand forecast remains relatively flat, then declines after 2029–30 as this scenario assumes the closure of large industrial businesses.
- Minimum operational demand (net of CSG) is expected to follow a declining trend throughout the forecast period, driven by projected increases in PV contribution. Queensland is expected to experience its minimum operational demand in the middle of the day by the mid-2020s.
- The trend of declining minimum operational demand is expected to be even greater in the Weak scenario.
South Australia
- Maximum operational demand is forecast to remain relatively flat, driven by projected increases in energy efficiency and PV contribution.
- As a percentage of maximum operational demand, South Australia’s forecast growth in PV is lower than New South Wales and Victoria, but starts from a much higher base. In 2016–17, installed PV capacity as a percentage of maximum underlying demand in South Australia is 25%, while it is 10% in New South Wales.
- Maximum summer operational demand (10% POE) is expected to occur after 7.00 pm by the mid-2020s.
- Minimum operational demand is expected to become negative by 2027–28 (later than was forecast last year) in the Neutral scenario. When minimum demand is negative in South Australia, the region would act as a net exporter of electricity. This also signals important opportunities for battery storage and to enable more efficient utilisation of energy across the day.
- South Australia has been experiencing its minimum operational demand in the middle of the day since 2012–13.
- In the base year for the forecast (2016–17), South Australia’s minimum operational demand (90% POE) is lower than it has historically been. This is due to the combination of assumed lower demand from the large industrial sector, high PV contribution, and milder weather than South Australia has experienced since the minimum moved to the middle of the day.
Tasmania
- Tasmania is a winter peaking system, driven by heating load. Maximum operational demand currently occurs in the evening, after the early winter sunset, as residential load ramps up and industrial load ramps down. This is expected to continue in the forecast period.
- Tasmania’s maximum operational demand is expected to increase at a similar rate to that forecast last year (with the exception of the Weak scenario, which is flatter compared to last year’s declining maximum operational demand forecast).
- Tasmania’s minimum operational demand occurs in the morning during summer, just after sunrise when temperatures are mild but before industry begins ramping up. This is expected to continue, as Tasmania is currently projected to have a slower PV uptake than other regions.
Victoria
- Maximum operational demand is expected to remain flat in the short term, then decrease slightly after 2018–19. From the mid-2020s, Victoria’s maximum operational demand is expect to increase due to forecast increasing population and appliance uptake (including gas-to-electric appliance switching).
- Minimum operational demand is expected to fall, and is expected to move to the middle of the day in the early 2020s.